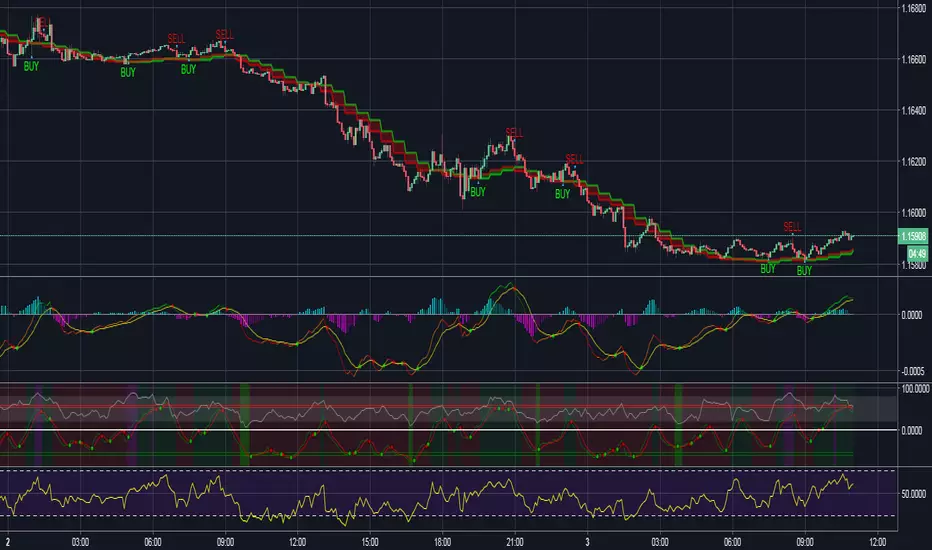
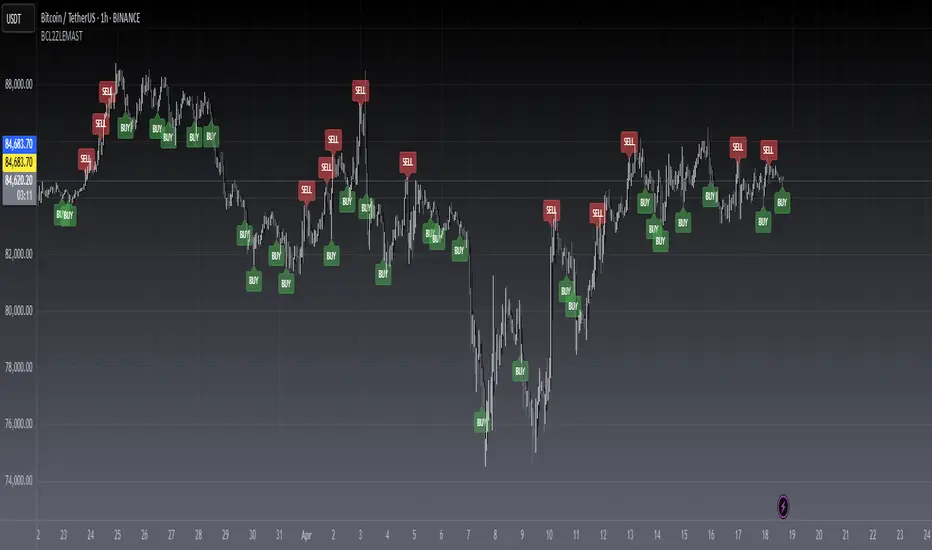
Forex Signal buy sell Pro [PlungerMen]Forex Signal buy sell Pro , mix 2 indicaror in it for exactly Signal
This Script is perfectly functional and works well by me and the best way to use this script is to use it with “Long Short" script, both compliment for each other. the "Long Short" script is Free, you can find it by searching
If you want to be more accurate and more efficient, more comfortable when you do not want to see too many other indicators, you can register for our Professional edition.
- The Professional Edition supports Level 1 and Level 2 commands ( display at chart : LONG+, long-, SHORT,+,short- ), which are very effective in allocating funds and optimizing your profits
Besides that,You will be supported by personal preferences, profit maximization -2.64% -1.30% -3.21% -3.33% -3.27% Scalping Pro and B Long Short Pro
- We will invite you to the signal channel Telgram with the announcement of the bottom and the peak of the BTC -2.64% -1.30% -3.21% -3.33% -3.27% 0.60% -0.13% ,the big variable variable has exists
**We hope you enjoy this script. Your support will help us develop more good quality scripts in the future to serve the community **
**Remember, Like this script and posivite feedback if you are satisfied**
if you have any questions, post a comment ... below here
*********** Guide:
+ option for all frames : Click setting and input high and low for time inteval
+ hide wave trend : Click setting -> click Style --> Up trend Fill or Down trend fill
******
New features: this time we add two lines that can help traders trader safer. When the red line cross above the green line means we are in the downtrend and when the green line cross above the red line, which means we are in a uptrend. This new features will help traders do a safer trade at small time frame.
We have the Script free for the user pass, search keyword " Bitmex Scalping PlungerMen"
-->> 0.2 eth/1 month will be used Script: BForex Signal buy sell Pro an Super Bot alert telegram <--
"the script" için komut dosyalarını ara
Bitmex margin PRO [PlungerMen]Hello!
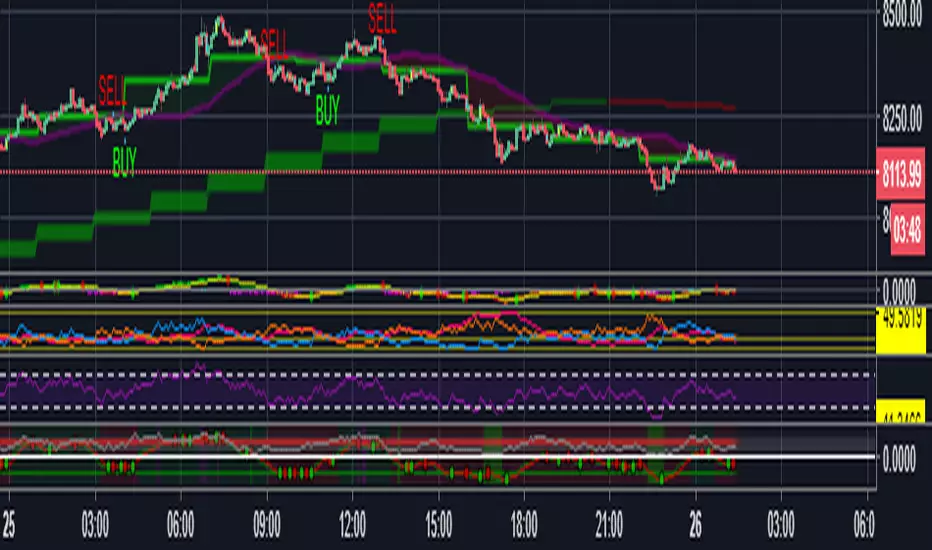
this is Update of Bitmex Scalping PRO , mix 2 indicaror in it for exactly Signal
Bitmex margin PRO can use for every coin
Bitmex margin PRO is available for all frames
This Script is perfectly functional and works well by me and the best way to use this script is to use it with “Bitmex Long Short" script, both compliment for each other. the "Bitmex Long Short" script is Free, you can find it by searching “Bimex”
If you want to be more accurate and more efficient, more comfortable when you do not want to see too many other indicators, you can register for our Professional edition.
- The Professional Edition supports Level 1 and Level 2 commands ( display at chart : LONG+, long-, SHORT,+,short- ), which are very effective in allocating funds and optimizing your profits
Besides that,You will be supported by personal preferences, profit maximization
- Register for a Professional version will be used 2 Script, Bitcoin -1.30% -3.21% -3.33% -3.27% Scalping Pro and Bitmex Long Short Pro
- We will invite you to the signal channel Telgram with the announcement of the bottom and the peak of the BTC -1.30% -3.21% -3.33% -3.27% 0.60% -0.13% ,the big variable variable has exists
**We hope you enjoy this script. Your support will help us develop more good quality scripts in the future to serve the community **
**Remember, Like this script and posivite feedback if you are satisfied**
if you have any questions, post a comment ... below here
*********** Guide:
+ option for all frames : Click setting and input high and low for time inteval
+ hide wave trend : Click setting -> click Style --> Up trend Fill or Down trend fill
******
New features: this time we add two lines that can help traders trader safer. When the red line cross above the green line means we are in the downtrend and when the green line cross above the red line, which means we are in a uptrend. This new features will help traders do a safer trade at small time frame.
We have the Script free for the user pass, search keyword " Bitmex Scalping PlungerMen"
-->> 0.2 eth/1 month will be used Script: Bitmex margin PRO an Super Bot alert telegram <--

Crypto Spiper Killer Pro [PlungerMen]Hello!
Crypto Spiper Killer Pro is a upgrade version of a Crypto Spiper Killer
Crypto Spiper Killer Pro can use for every coin
Crypto Spiper Killer Pro is available for all frames
This Script is perfectly functional and works well by me and the best way to use this script is to use it with “Bitmex Long Short" script, both compliment for each other. the "Bitmex Long Short" script is Free, you can find it by searching “Bimex”
If you want to be more accurate and more efficient, more comfortable when you do not want to see too many other indicators, you can register for our Professional edition.
- The Professional Edition supports Level 1 and Level 2 commands ( display at chart : LONG+, long-, SHORT,+,short- ), which are very effective in allocating funds and optimizing your profits
Besides that,You will be supported by personal preferences, profit maximization
- Register for a Professional version will be used 2 Script, Bitcoin -0.95% -3.33% -3.27% Scalping Pro and Bitmex Long Short Pro
- We will invite you to the signal channel Telgram with the announcement of the bottom and the peak of the BTC -0.95% -3.33% -3.27% 0.60% -0.13% ,the big variable variable has exists
**We hope you enjoy this script. Your support will help us develop more good quality scripts in the future to serve the community **
**Remember, Like this script and posivite feedback if you are satisfied**
if you have any questions, post a comment ... below here
*********** Guide:
+ option for all frames : Click setting and input high and low for time inteval
+ hide wave trend : Click setting -> click Style --> Up trend Fill or Down trend fill
******
New features: this time we add two lines that can help traders trader safer. When the red line cross above the green line means we are in the downtrend and when the green line cross above the red line, which means we are in a uptrend. This new features will help traders do a safer trade at small time frame.
We have the Script free for the user pass, search keyword " Crypto Spiper Killer Pro "
-->> 0.2 eth/1 month will be used 2 Script: Crypto Spiper Killer Pro and Bitmex Long Short Pro - and Super Bot telegram

Bitmex Scalping PRO Study [PlungerMen]Hello!
Bitmex Scalping PRO Study have the alert, because BitMex Scalping PRO V2 is another format ( not have alert)
BitMex Scalping PRO V2 can use for every coin
BitMex Scalping PRO V2 is available for all frames
This Script is perfectly functional and works well by me and the best way to use this script is to use it with “Bitmex Long Short" script, both compliment for each other. the "Bitmex Long Short" script is Free, you can find it by searching “Bimex”
If you want to be more accurate and more efficient, more comfortable when you do not want to see too many other indicators, you can register for our Professional edition.
- The Professional Edition supports Level 1 and Level 2 commands ( display at chart : LONG+, long-, SHORT,+,short- ), which are very effective in allocating funds and optimizing your profits
Besides that,You will be supported by personal preferences, profit maximization
- Register for a Professional version will be used 2 Script, Bitcoin -3.21% -3.33% -3.27% Scalping Pro and Bitmex Long Short Pro
- We will invite you to the signal channel Telgram with the announcement of the bottom and the peak of the BTC -3.21% -3.33% -3.27% 0.60% -0.13% ,the big variable variable has exists
**We hope you enjoy this script. Your support will help us develop more good quality scripts in the future to serve the community **
**Remember, Like this script and posivite feedback if you are satisfied**
if you have any questions, post a comment ... below here
*********** Guide:
+ option for all frames : Click setting and input high and low for time inteval
+ hide wave trend : Click setting -> click Style --> Up trend Fill or Down trend fill
******
New features: this time we add two lines that can help traders trader safer. When the red line cross above the green line means we are in the downtrend and when the green line cross above the red line, which means we are in a uptrend. This new features will help traders do a safer trade at small time frame.
We have the Script free for the user pass, search keyword " Bitmex Scalping PlungerMen"
-->> 0.2 eth/1 month will be used 2 Script: Bitmex Scalping Pro and Bitmex Long Short Pro <--
Bitcoin Scalping PRO [PlungerMen] Hello!
Bitcoin Scalping PRO can use for every coin
Bitcoin Scalping PRO is available for all frames
Bitcoin Scalping PRO is a upgrade version of a Bitmex Scalping Pro
This Script is perfectly functional and works well by me and the best way to use this script is to use it with “Bitmex Long Short" script, both compliment for each other. the "Bitmex Long Short" script is Free, you can find it by searching “Bimex”
If you want to be more accurate and more efficient, more comfortable when you do not want to see too many other indicators, you can register for our Professional edition.
- The Professional Edition supports Level 1 and Level 2 commands ( display at chart : LONG+, long-, SHORT,+,short- ), which are very effective in allocating funds and optimizing your profits
Besides that,You will be supported by personal preferences, profit maximization
- Register for a Professional version will be used 2 Script, Bitcoin Scalping Pro and Bitmex Long Short Pro
- We will invite you to the signal channel Telgram with the announcement of the bottom and the peak of the BTC 0.60% -0.13% ,the big variable variable has exists
**We hope you enjoy this script. Your support will help us develop more good quality scripts in the future to serve the community **
**Remember, Like this script and posivite feedback if you are satisfied**
if you have any questions, post a comment ... below here
*********** Guide:
+ option for all frames : Click setting and input high and low for time inteval
+ hide wave trend : Click setting -> click Style --> Up trend Fill or Down trend fill
******
New features: this time we add two lines that can help traders trader safer. When the red line cross above the green line means we are in the downtrend and when the green line cross above the red line, which means we are in a uptrend. This new features will help traders do a safer trade at small time frame.
We have the Script free for the user pass, search keyword " Bitmex Scalping PlungerMen"
-->> 0.2 eth/1 month will be used 2 Script: Bitcoin Scalping Pro and Bitmex Long Short Pro <--

GIGANEVA V6.61 PublicThis enhanced Fibonacci script for TradingView is a powerful, all-in-one tool that calculates Fibonacci Levels, Fans, Time Pivots, and Golden Pivots on both logarithmic and linear scales. Its ability to compute time pivots via fan intersections and Range interactions, combined with user-friendly features like Bool Fib Right, sets it apart. The script maximizes TradingView’s plotting capabilities, making it a unique and versatile tool for technical analysis across various markets.
1. Overview of the Script
The script appears to be a custom technical analysis tool built for TradingView, improving upon an existing script from TradingView’s Community Scripts. It calculates and plots:
Fibonacci Levels: Standard retracement levels (e.g., 0.236, 0.382, 0.5, 0.618, etc.) based on a user-defined price range.
Fibonacci Fans: Trendlines drawn from a high or low point, radiating at Fibonacci ratios to project potential support/resistance zones.
Time Pivots: Points in time where significant price action is expected, determined by the intersection of Fibonacci Fans or their interaction with key price levels.
Golden Pivots: Specific time pivots calculated when the 0.5 Fibonacci Fan (on a logarithmic or linear scale) intersects with its counterpart.
The script supports both logarithmic and linear price scales, ensuring versatility across different charting preferences. It also includes a feature to extend Fibonacci Fans to the right, regardless of whether the user selects the top or bottom of the range first.
2. Key Components Explained
a) Fibonacci Levels and Fans from Top and Bottom of the "Range"
Fibonacci Levels: These are horizontal lines plotted at standard Fibonacci retracement ratios (e.g., 0.236, 0.382, 0.5, 0.618, etc.) based on a user-defined price range (the "Range"). The Range is typically the distance between a significant high (top) and low (bottom) on the chart.
Example: If the high is $100 and the low is $50, the 0.618 retracement level would be at $80.90 ($50 + 0.618 × $50).
Fibonacci Fans: These are diagonal lines drawn from either the top or bottom of the Range, radiating at Fibonacci ratios (e.g., 0.382, 0.5, 0.618). They project potential dynamic support or resistance zones as price evolves over time.
From Top: Fans drawn downward from the high of the Range.
From Bottom: Fans drawn upward from the low of the Range.
Log and Linear Scale:
Logarithmic Scale: Adjusts price intervals to account for percentage changes, which is useful for assets with large price ranges (e.g., cryptocurrencies or stocks with exponential growth). Fibonacci calculations on a log scale ensure ratios are proportional to percentage moves.
Linear Scale: Uses absolute price differences, suitable for assets with smaller, more stable price ranges.
The script’s ability to plot on both scales makes it adaptable to different markets and user preferences.
b) Time Pivots
Time pivots are points in time where significant price action (e.g., reversals, breakouts) is anticipated. The script calculates these in two ways:
Fans Crossing Each Other:
When two Fibonacci Fans (e.g., one from the top and one from the bottom) intersect, their crossing point represents a potential time pivot. This is because the intersection indicates a convergence of dynamic support/resistance zones, increasing the likelihood of a price reaction.
Example: A 0.618 fan from the top crosses a 0.382 fan from the bottom at a specific bar on the chart, marking that bar as a time pivot.
Fans Crossing Top and Bottom of the Range:
A fan line (e.g., 0.5 fan from the bottom) may intersect the top or bottom price level of the Range at a specific time. This intersection highlights a moment where the fan’s projected support/resistance aligns with a key price level, signaling a potential pivot.
Example: The 0.618 fan from the bottom reaches the top of the Range ($100) at bar 50, marking bar 50 as a time pivot.
c) Golden Pivots
Definition: Golden pivots are a special type of time pivot calculated when the 0.5 Fibonacci Fan on one scale (logarithmic or linear) intersects with the 0.5 fan on the opposite scale (or vice versa).
Significance: The 0.5 level is the midpoint of the Fibonacci sequence and often acts as a critical balance point in price action. When fans at this level cross, it suggests a high-probability moment for a price reversal or significant move.
Example: If the 0.5 fan on a logarithmic scale (drawn from the bottom) crosses the 0.5 fan on a linear scale (drawn from the top) at bar 100, this intersection is labeled a "Golden Pivot" due to its confluence of key Fibonacci levels.
d) Bool Fib Right
This is a user-configurable setting (a boolean input in the script) that extends Fibonacci Fans to the right side of the chart.
Functionality: When enabled, the fans project forward in time, regardless of whether the user selected the top or bottom of the Range first. This ensures consistency in visualization, as the direction of the Range selection (top-to-bottom or bottom-to-top) does not affect the fan’s extension.
Use Case: Traders can use this to project future support/resistance zones without worrying about how they defined the Range, improving usability.
3. Why Is This Code Unique?
Original calculation of Log levels were taken from zekicanozkanli code. Thank you for giving me great Foundation, later modified and applied to Fib fans. The script’s uniqueness stems from its comprehensive integration of Fibonacci-based tools and its optimization for TradingView’s plotting capabilities. Here’s a detailed breakdown:
All-in-One Fibonacci Tool:
Most Fibonacci scripts on TradingView focus on either retracement levels, extensions, or fans.
This script combines:
Fibonacci Levels: Static horizontal lines for retracement and extension.
Fibonacci Fans: Dynamic trendlines for projecting support/resistance.
Time Pivots: Temporal analysis based on fan intersections and Range interactions.
Golden Pivots: Specialized pivots based on 0.5 fan confluences.
By integrating these functions, the script provides a holistic Fibonacci analysis tool, reducing the need for multiple scripts.
Log and Linear Scale Support:
Many Fibonacci tools are designed for linear scales only, which can distort projections for assets with exponential price movements. By supporting both logarithmic and linear scales, the script caters to a wider range of markets (e.g., stocks, forex, crypto) and user preferences.
Time Pivot Calculations:
Calculating time pivots based on fan intersections and Range interactions is a novel feature. Most TradingView scripts focus on price-based Fibonacci levels, not temporal analysis. This adds a predictive element, helping traders anticipate when significant price action might occur.
Golden Pivot Innovation:
The concept of "Golden Pivots" (0.5 fan intersections across scales) is a unique addition. It leverages the symmetry of the 0.5 level and the differences between log and linear scales to identify high-probability pivot points.
Maximized Plot Capabilities:
TradingView imposes limits on the number of plots (lines, labels, etc.) a script can render. This script is coded to fully utilize these limits, ensuring that all Fibonacci levels, fans, pivots, and labels are plotted without exceeding TradingView’s constraints.
This optimization likely involves efficient use of arrays, loops, and conditional plotting to manage resources while delivering a rich visual output.
User-Friendly Features:
The Bool Fib Right option simplifies fan projection, making the tool intuitive even for users who may not consistently select the Range in the same order.
The script’s flexibility in handling top/bottom Range selection enhances usability.
4. Potential Use Cases
Trend Analysis: Traders can use Fibonacci Fans to identify dynamic support/resistance zones in trending markets.
Reversal Trading: Time pivots and Golden Pivots help pinpoint moments for potential price reversals.
Range Trading: Fibonacci Levels provide key price zones for trading within a defined range.
Cross-Market Application: Log/linear scale support makes the script suitable for stocks, forex, commodities, and cryptocurrencies.
The original code was from zekicanozkanli . Thank you for giving me great Foundation.

Volatility Adaptive Signal Tracker (VAST)The Adaptive Trend Following Buy/Sell Signals Pine Script is designed to help traders identify and capitalize on market trends using an adaptive trend-following strategy. This script focuses on generating reliable buy and sell signals by analyzing market trends and volatility. It simplifies the trading process by providing clear signals without plotting additional lines, making it easy to use and interpret.
Key Features:
Adaptive Trend Following:
The script employs an adaptive trend-following approach that leverages market volatility to generate buy and sell signals. This method is effective in both trending and volatile markets.
Inputs and Customization:
The script includes customizable parameters for the Simple Moving Average (SMA) length, the Average True Range (ATR) length, and the ATR multiplier. These inputs allow traders to adjust the sensitivity of the signals to match their trading style and market conditions.
Signal Generation:
Buy Signal: Generated when the closing price crosses above the upper adaptive band, indicating a potential upward trend.
Sell Signal: Generated when the closing price crosses below the lower adaptive band, indicating a potential downward trend.
Visual Signals:
The script uses plotshape to mark buy signals with green labels below the bars and sell signals with red labels above the bars. This clear visual representation helps traders quickly identify trading opportunities.
Alert Conditions:
The script sets up alert conditions for both buy and sell signals. Traders can use these alerts to receive notifications when a signal is generated, ensuring they do not miss any trading opportunities.
How It Works:
SMA Calculation: The script calculates the Simple Moving Average (SMA) over a specified period, which helps in identifying the general trend direction.
ATR Calculation: The Average True Range (ATR) is calculated to measure market volatility.
Adaptive Bands: Upper and lower adaptive bands are created by adding and subtracting a multiple of the ATR to the SMA, respectively.
Signal Logic: Buy signals are generated when the closing price crosses above the upper band, while sell signals are generated when the closing price crosses below the lower band.
Example Use Case:
A trader looking to capitalize on medium-term trends in the Nifty futures market can use this script to receive timely buy and sell signals. By customizing the SMA length and ATR parameters, the trader can fine-tune the script to match their trading strategy, ensuring they enter and exit trades at optimal points.
Benefits:
Simplicity: The script provides clear buy and sell signals without cluttering the chart with additional lines or indicators.
Adaptability: Customizable parameters allow traders to adapt the script to various market conditions and trading styles.
Alerts: Built-in alert conditions ensure traders receive timely notifications, helping them to act quickly on trading signals.
How to Use:
Open TradingView: Go to the TradingView website and log in.
Create a New Chart: Click on the “Chart” button to open a new chart.
Open the Pine Script Editor: Click on the “Pine Editor” tab at the bottom of the chart.
Create a New Script: Delete any default code in the Pine Script editor and paste the provided script.
Add to Chart: Click on the “Add to Chart” button to compile and add the script to your chart.
Save the Script: Click “Save” and name the script.
Set Alerts: Right-click on the chart, select “Add Alert,” and choose the appropriate condition to set alerts for buy and sell signals.

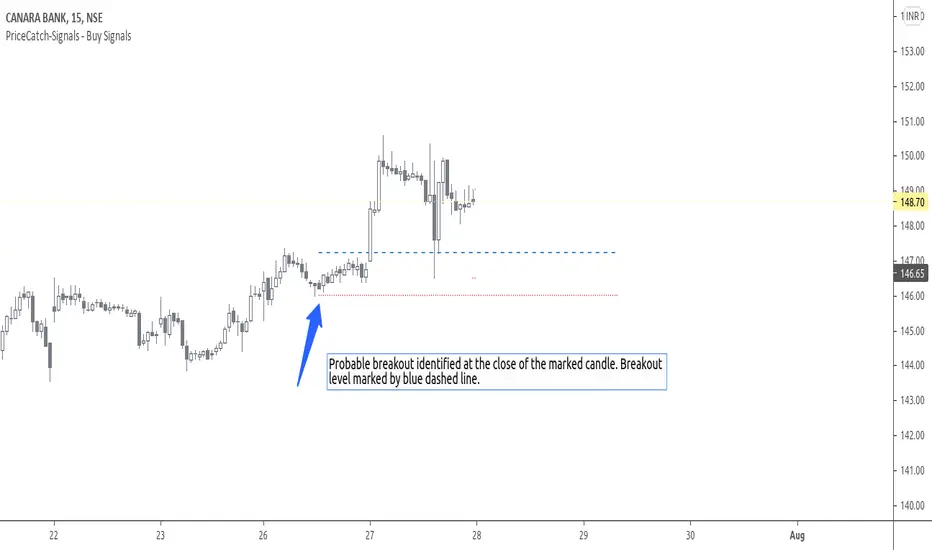
PriceCatch-Signals - Buy SignalsHi,
TradingView Community.
Here is a script that identifies and marks two different buy levels on the chart. It works on all asset classes - equities, forex, crypto.
Probable Breakout Buy Level
Stop-Reverse Buy Level
The bottom images are self-explanatory.
PROBABLE BREAKOUT BUY LEVEL EXAMPLE:
STOP-REVERSE BUY LEVEL EXAMPLE:
IDENTIFICATION OF LEVELS:
The Blue Dotted line represents Probable Breakout Buy Level and the Blue Dashed Line Stop-Reverse Buy Level. The corresponding Red Dotted line below each level should be your initial stop loss price point.
PLAYING SAFE
After taking the trade, to play safe, I follow this method that once the Low of the price goes above the Buy Level, I usually shift the stop loss to buy price to protect against any sudden reversal. For me protecting capital is important. As usual with price action, longer time-frames produce more reliable signals.
NOTE - PRIOR TO USING THIS SCRIPT:
The script uses Heikin-Ashi Candles data to identify the levels. You may use this script in addition to your other indicators or in isolation. Please remember that the script is shared with absolutely no assurances and warranties whatsoever and as a responsible trader, please satisfy yourselves thoroughly and use it only if you are satisfied it works for you. Remember, you are 100% responsible for your actions. If you understand and accept that, you may use the script. The script does not identify any short signals.
ADDITIONAL NOTE:
I shall also be releasing Screener scripts that scan the following markets for the above two conditions or signals thereby helping traders spot opportunities at the right time by making the task of finding right stocks a breeze.
NASDAQ Stocks Screener (Can screen a total number of 160 stocks. 40 stocks at a time)
UK LSE Stocks Screener (Can screen a total number of 90 stocks. 30 stocks at a time)
Euronext Paris Stocks Screener (Can screen a total number of 50 stocks. 25 stocks at a time) - in development.
Singapore Stocks Screener is in development
Other International exchanges will be added based on response from users.
SOME MORE CHARTS:
QUERIES/FEEDBACK
Please PM me.
Regards to all and wish everyone all the best with trading.
PriceCatch-Signals - Buy SignalHi,
TradingView Community.
Here is a script that identifies and marks two different buy levels on the chart. It works on all asset classes - equities, forex, crypto.
Probable Breakout Buy Level
Stop-Reverse Buy Level
The bottom images are self-explanatory.
PROBABLE BREAKOUT BUY LEVEL EXAMPLE:
STOP-REVERSE BUY LEVEL EXAMPLE:
IDENTIFICATION OF LEVELS:
The Blue Dotted line represents Probable Breakout Buy Level and the Blue Dashed Line Stop-Reverse Buy Level. The corresponding Red Dotted line below each level should be your initial stop loss price point.
PLAYING SAFE
After taking the trade, to play safe, I follow this method that once the Low of the price goes above the Buy Level, I usually shift the stop loss to buy price to protect against any sudden reversal. For me protecting capital is important. As usual with price action, longer time-frames produce more reliable signals.
NOTE - PRIOR TO USING THIS SCRIPT:
The script uses Heikin-Ashi Candles data to identify the levels. You may use this script in addition to your other indicators or in isolation. Please remember that the script is shared with absolutely no assurances and warranties whatsoever and as a responsible trader, please satisfy yourselves thoroughly and use it only if you are satisfied it works for you. Remember, you are 100% responsible for your actions. If you understand and accept that, you may use the script. The script does not identify any short signals.
ADDITIONAL NOTE:
I shall also be releasing Screener scripts that scan the following markets for the above two conditions or signals thereby helping traders spot opportunities at the right time by making the task of finding right stocks a breeze.
NASDAQ Stocks Screener (Can screen a total number of 160 stocks. 40 stocks at a time)
UK LSE Stocks Screener (Can screen a total number of 90 stocks. 30 stocks at a time)
Euronext Paris Stocks Screener (Can screen a total number of 50 stocks. 25 stocks at a time) - in development.
Singapore Stocks Screener is in development
Other International exchanges will be added based on response from users.
SOME MORE CHARTS:
QUERIES/FEEDBACK
Please PM me.
Regards to all and wish everyone all the best with trading.

PriceCatch-SignalsHi,
TradingView Community.
Here is a script that identifies and marks two different buy levels on the chart. It works on all asset classes - equities, forex, crypto.
Probable Breakout Buy Level
Stop-Reverse Buy Level
The bottom images are self-explanatory.
PROBABLE BREAKOUT BUY LEVEL EXAMPLE:
STOP-REVERSE BUY LEVEL EXAMPLE:
IDENTIFICATION OF LEVELS:
The Blue Dotted line represents Probable Breakout Buy Level and the Blue Dashed Line Stop-Reverse Buy Level. The corresponding Red Dotted line below each level should be your initial stop loss price point.
PLAYING SAFE
After taking the trade, to play safe, I follow this method that once the Low of the price goes above the Buy Level, I usually shift the stop loss to buy price to protect against any sudden reversal. For me protecting capital is important. As usual with price action, longer time-frames produce more reliable signals.
NOTE - PRIOR TO USING THIS SCRIPT:
The script uses Heikin-Ashi Candles data to identify the levels. You may use this script in addition to your other indicators or in isolation. Please remember that the script is shared with absolutely no assurances and warranties whatsoever and as a responsible trader, please satisfy yourselves thoroughly and use it only if you are satisfied it works for you. Remember, you are 100% responsible for your actions. If you understand and accept that, you may use the script. The script does not identify any short signals.
ADDITIONAL NOTE:
I shall also be releasing Screener scripts that scan the following markets for the above two conditions or signals thereby helping traders spot opportunities at the right time by making the task of finding right stocks a breeze.
NASDAQ Stocks Screener (Can screen a total number of 160 stocks. 40 stocks at a time)
UK LSE Stocks Screener (Can screen a total number of 90 stocks. 30 stocks at a time)
Euronext Paris Stocks Screener (Can screen a total number of 50 stocks. 25 stocks at a time) - in development.
Singapore Stocks Screener is in development
Other International exchanges will be added based on response from users.
SOME MORE CHARTS:
QUERIES/FEEDBACK
Please PM me.
Regards to all and wish everyone all the best with trading.

Point and Figure Chart - LiveHello Traders,
This is "Point and Figure Chart (PnF)" script that run in separated window in real time. The separated PnF chart window is timeless, so no relation with the time on the chart. PnF chart consist of "X" and "O" columns. While "X" columns represents rising prices, "O" column represents a falling price. If you have no idea about what PnF charting is then you should search for "Point and Figure Charting" on the net and get some info before using this script.
Now lets talk about details. PnF Chart requires at least two variables to be set => Box size and Reversal. Box size represents the size of each X/O in PnF chart and the reversal is used to calculate new X/O or reversal. for example if currrent column is X column then for new "X", "box size * 1" move is needed and for new "O" column or reversal, "box size * revelsal" move is needed. in the script I use lines as X/O columns.
In the options you can set "Box Size Assingment Method". you have 3 options Traditional, ATR, Percentage . what are they?
Traditional: user-defined box size, means you can set the box size as you wish, using the option . if you use this option then you should set it accordingly.
ATR : that's dynamic box size scaling and on each columns it's calculated once, you can set length for ATR
Percentage: that's also dynamic box size scaling according to closing price when new column appeared. if you use this option then you should set it accordingly.
Reversal: The reversal is typically 3 but you can change it as you wish
"Change Bar Color by PnF Trend": if you enable this option then bar color changes by PnF columns, by default it's not enabled
"Change Column Color When Breakout Occurs": PnF color changes if Double Top/Bottom breakout accours. enabled by default and you can set the colors as you wish using the options
"Change Bar Color When Breakout Occurs": bar colors changed if Double Top/Bottom breakout accours. enabled by default and you can set the colors as you wish using the options
the script checks only Double Top/Bottom breakouts at the moment. there are many other breakouts such Triple/Quadruple, Ascending/Descending Triple Top/Bottom breakouts, Catapult etc.
Also the script shows new X/O level and reversal Levels in PnF window. An example:
If you enable "Change Bar Color by PnF Trend" option:
An example if you disable the option "Change Column Color When Breakout Occurs
You may want to see my another/older "Point and Point Chart" script as well. you can find it in my profile/published scripts and in the Public Library. I use same PnF calculation algorithm in both scripts.
Enjoy!

GTrader-ICT All In One-Comumnity VersionMeet the **GTrader-ICT All In One **, a comprehensive toolkit designed to integrate key Inner Circle Trader (ICT) concepts directly onto your chart. This powerful overlay indicator consolidates multiple essential tools, streamlining your technical analysis and helping you identify key temporal and price-based events.
📚 References & Inspiration
This indicator stands on the shoulders of giants. With the help of **tradeforopp** and **LuxAlgo**. The concepts and some implementation details were referenced from the following excellent, publicly available scripts:
ICT Killzones: The session drawing and pivot logic is adapted from tradeforopp
ICT Macros: The macro detection and plotting functionality is inspired by the work of Lux Algo , particularly their widely-used indicators covering ICT concepts.
🎯 Core Features
* **ICT Killzones:** Visualize critical trading sessions with customizable boxes. You can easily toggle and style the **Asia**, **London**, and **New York (AM, Lunch, PM)** sessions to focus on the liquidity and volatility that matter most to your strategy.
* Fully customizable session times and colors.
* Timezone support to align sessions with your local or preferred trading time (defaults to `America/New_York`).
* **ICT Macros:** Automatically identify and plot specific, short-duration time windows where institutional algorithms are known to be active (e.g., `09:50-10:10`, `14:50-15:10`, etc.).
* Plots the high/low range of the macro, providing clear levels of interest.
* Utilizes 1-minute data for precision, even when viewing on 3-minute or 5-minute charts.
📚 Optimization over the other original indicators
We add the custom input for macros session, users just need to input the from/to hour: minute format, and they will be converted into session objects in pinescript
The macro draws function is optimized, removing redundant draws, leading to better performance
Add "Distance from Macro Line to Chart" option
Add "Session Drawings Limit" for better performance
⚠️ Notes on TradingView Warnings
You may encounter some warnings from TradingView when using this script. These are generally expected due to the script's advanced, event-driven nature:
1. **Function Call Consistency:** The function 'box.new' should be called on each calculation for consistency, which may appear. This happens because drawing elements (like session boxes) are intentionally created only on the *first bar* of a new session, not on every single bar. This is a necessary design choice for performance and to prevent duplicate drawings.
2. **Potential for Repainting/Slow Load:** The **Macro** feature uses the `request.security_lower_tf()` function to get accurate 1-minute data. This can trigger warnings about performance or slow loading times. This is a known trade-off for achieving the precision required for the feature.

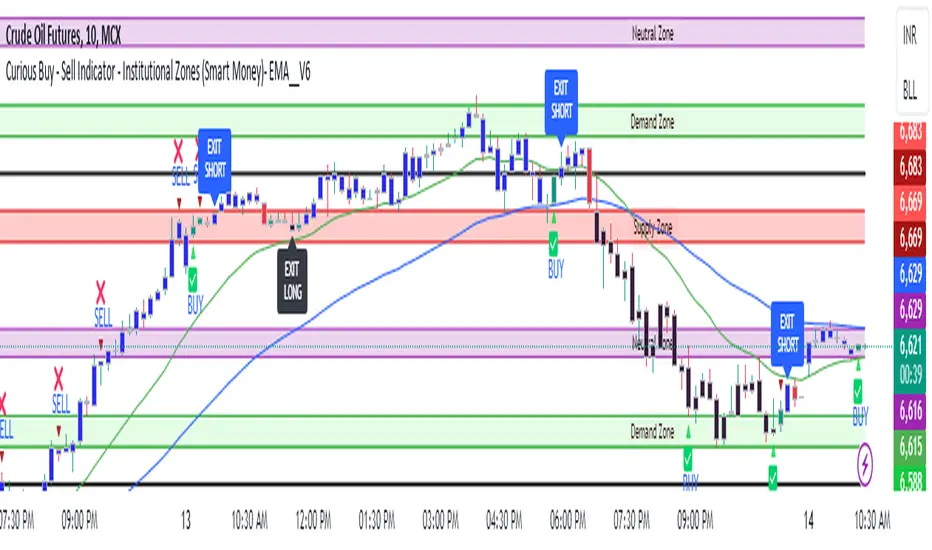
Curious Buy - Sell Indicator - Institutional Zones (Smart Money)How the Script Works:
1. The Scripts identifies Institutional Demand , Supply & Neutral Zones with FIBS on the scripts with Rectangle BOX with labels in advance. User can insert desired start and end value to plot institutional zones
2. Script generates BUY - SELL signals shape based on candle stick formation in live market and labels with BUY - SELL image for easy identification
3. Script gives pop message EXIT SHORT once Buy spotted and candle close above the buy signal and same way EXIT LONG once Sell spotted and candle close below the buy signal
4. Scripts identifies the candle closing above the BUY - SELL signals Eg - If buy spotted the candle closing above the BUY signal with display with BLUE color Candle same way for sell signal the candle closing below the sell signal candle with display with BLACK color candle.
5. Script spots fake signals which are not valid and can be ignored by the end user
6. Three EMA's 20,50,200 has implemented to identify the strength of the market
7. Scripts identifies OPEN = LOW & OPEN = HIGH candle stick to spot the Institutional BUY - SELL activity
8. The script provides visual clues on the chart to help users identify potential trading opportunities.
9. The script provides visual clues on the chart to help users identity potential trading opportunities in live market
10. The looks and parameters of the script can be modified by end user to customize and adapt to different strategy.
11. With the script user can check higher time frame DAILY \ WEEKLY BUY - SELL signals to plan intraday trades and plan safe BUY - SELL positions.
How Users Can Make Profit Using This Script:
1. Identify potential BUY - LONG opportunities: When a valid BUY is detected and condition is met, it is suggested to opening BUY position with stoploss below the BUY signal spotted candle.
Safe users can execute BUY position once BLUE COLOR candle is formed, Wait for pull back to reduce the stoploss
2. Identify potential SELL - SHORT opportunities: When a valid SELL is detected and condition is met, it suggests a potential opening SELL positions with stoploss above the BUY signal spotted candle. Safe users can execute SELL position once BLACK COLOR candle is formed, Wait for pull back to reduce the stoploss.
3. Script generated BUY - SELL signal met target with the Institutional zone. Eg if BUY spotted at demand zone target will be neutral zone & Supply zone.
4. Script designed for user to spot high probability trades when BUY SIGNAL SPOTTED at the Institutional Demand zone same way SELL SIGNAL SPOTTED AT INSTITUTIONAL supply zone.
5. Combine with additional analysis: Users can utilize this script as a tool in their overall trading strategy. They can combine the signals with fundament analysis , market sentiment to make more informed trading decision
6.Set risk management measures: It is important for users to implement proper risk management strategies when trading based on the scripts signals. To avoid potential losses user once spotted BUY - SELL execute the long or short position. Ensure to place the stoploss to avoid potential losses and place the target. Once your trade is moving in your favor
can trial your stoploss to cost and protect the profits.
Higher-timeframe requests█ OVERVIEW
This publication focuses on enhancing awareness of the best practices for accessing higher-timeframe (HTF) data via the request.security() function. Some "traditional" approaches, such as what we explored in our previous `security()` revisited publication, have shown limitations in their ability to retrieve non-repainting HTF data. The fundamental technique outlined in this script is currently the most effective in preventing repainting when requesting data from a higher timeframe. For detailed information about why it works, see this section in the Pine Script™ User Manual .
█ CONCEPTS
Understanding repainting
Repainting is a behavior that occurs when a script's calculations or outputs behave differently after restarting it. There are several types of repainting behavior, not all of which are inherently useless or misleading. The most prevalent form of repainting occurs when a script's calculations or outputs exhibit different behaviors on historical and realtime bars.
When a script calculates across historical data, it only needs to execute once per bar, as those values are confirmed and not subject to change. After each historical execution, the script commits the states of its calculations for later access.
On a realtime, unconfirmed bar, values are fluid . They are subject to change on each new tick from the data provider until the bar closes. A script's code can execute on each tick in a realtime bar, meaning its calculations and outputs are subject to realtime fluctuations, just like the underlying data it uses. Each time a script executes on an unconfirmed bar, it first reverts applicable values to their last committed states, a process referred to as rollback . It only commits the new values from a realtime bar after the bar closes. See the User Manual's Execution model page to learn more.
In essence, a script can repaint when it calculates on realtime bars due to fluctuations before a bar's confirmation, which it cannot reproduce on historical data. A common strategy to avoid repainting when necessary involves forcing only confirmed values on realtime bars, which remain unchanged until each bar's conclusion.
Repainting in higher-timeframe (HTF) requests
When working with a script that retrieves data from higher timeframes with request.security() , it's crucial to understand the differences in how such requests behave on historical and realtime bars .
The request.security() function executes all code required by its `expression` argument using data from the specified context (symbol, timeframe, or modifiers) rather than on the chart's data. As when executing code in the chart's context, request.security() only returns new historical values when a bar closes in the requested context. However, the values it returns on realtime HTF bars can also update before confirmation, akin to the rollback and recalculation process that scripts perform in the chart's context on the open bar. Similar to how scripts operate in the chart's context, request.security() only confirms new values after a realtime bar closes in its specified context.
Once a script's execution cycle restarts, what were previously realtime bars become historical bars, meaning the request.security() call will only return confirmed values from the HTF on those bars. Therefore, if the requested data fluctuates across an open HTF bar, the script will repaint those values after it restarts.
This behavior is not a bug; it's simply the default behavior of request.security() . In some cases, having the latest information from an unconfirmed HTF bar is precisely what a script needs. However, in many other cases, traders will require confirmed, stable values that do not fluctuate across an open HTF bar. Below, we explain the most reliable approach to achieve such a result.
Achieving consistent timing on all bars
One can retrieve non-fluctuating values with consistent timing across historical and realtime feeds by exclusively using request.security() to fetch the data from confirmed HTF bars. The best way to achieve this result is offsetting the `expression` argument by at least one bar (e.g., `close [1 ]`) and using barmerge.lookahead_on as the `lookahead` argument.
We discourage the use of barmerge.lookahead_on alone since it prompts the function to look toward future values of HTF bars across historical data, which is heavily misleading. However, when paired with a requested `expression` that includes a one-bar historical offset, the "future" data the function retrieves is not from the future. Instead, it represents the last confirmed bar's values at the start of each HTF bar, thus preventing the results on realtime bars from fluctuating before confirmation from the timeframe.
For example, this line of code uses a request.security() call with barmerge.lookahead_on to request the close price from the "1D" timeframe, offset by one bar with the history-referencing operator [ ] . This line will return the daily price with consistent timing across all bars:
float htfClose = request.security(syminfo.tickerid, "1D", close , lookahead = barmerge.lookahead_on)
Note that:
• This technique only works as intended for higher-timeframe requests .
• When designing a script to work specifically with HTFs, we recommend including conditions to prevent request.security() from accessing timeframes equal to or lower than the chart's timeframe, especially if you intend to publish it. In this script, we included an if structure that raises a runtime error when the requested timeframe is too small.
• A necessary trade-off with this approach is that the script must wait for an HTF bar's confirmation to retrieve new data on realtime bars, thus delaying its availability until the open of the subsequent HTF bar. The time elapsed during such a delay varies with each market, but it's typically relatively small.
👉 Failing to offset the function's `expression` argument while using barmerge.lookahead_on will produce historical results with lookahead bias , as it will look to the future states of historical HTF bars, retrieving values before the times at which they're available in the feed. See the `lookahead` and Future leak with `request.security()` sections in the Pine Script™ User Manual for more information.
Evolving practices
The fundamental technique outlined in this publication is currently the only reliable approach to requesting non-repainting HTF data with request.security() . It is the superior approach because it avoids the pitfalls of other methods, such as the one introduced in the `security()` revisited publication. That publication proposed using a custom `f_security()` function, which applied offsets to the `expression` and the requested result based on historical and realtime bar states. At that time, we explored techniques that didn't carry the risk of lookahead bias if misused (i.e., removing the historical offset on the `expression` while using lookahead), as requests that look ahead to the future on historical bars exhibit dangerously misleading behavior.
Despite these efforts, we've unfortunately found that the bar state method employed by `f_security()` can produce inaccurate results with inconsistent timing in some scenarios, undermining its credibility as a universal non-repainting technique. As such, we've deprecated that approach, and the Pine Script™ User Manual no longer recommends it.
█ METHOD VARIANTS
In this script, all non-repainting requests employ the same underlying technique to avoid repainting. However, we've applied variants to cater to specific use cases, as outlined below:
Variant 1
Variant 1, which the script displays using a lime plot, demonstrates a non-repainting HTF request in its simplest form, aligning with the concept explained in the "Achieving consistent timing" section above. It uses barmerge.lookahead_on and offsets the `expression` argument in request.security() by one bar to retrieve the value from the last confirmed HTF bar. For detailed information about why this works, see the Avoiding Repainting section of the User Manual's Other timeframes and data page.
Variant 2
Variant 2 ( fuchsia ) introduces a custom function, `htfSecurity()`, which wraps the request.security() function to facilitate convenient repainting control. By specifying a value for its `repaint` parameter, users can determine whether to allow repainting HTF data. When the `repaint` value is `false`, the function applies lookahead and a one-bar offset to request the last confirmed value from the specified `timeframe`. When the value is `true`, the function requests the `expression` using the default behavior of request.security() , meaning the results can fluctuate across chart bars within realtime HTF bars and repaint when the script restarts.
Note that:
• This function exclusively handles HTF requests. If the requested timeframe is not higher than the chart's, it will raise a runtime error .
• We prefer this approach since it provides optional repainting control. Sometimes, a script's calculations need to respond immediately to realtime HTF changes, which `repaint = true` allows. In other cases, such as when issuing alerts, triggering strategy commands, and more, one will typically need stable values that do not repaint, in which case `repaint = false` will produce the desired behavior.
Variant 3
Variant 3 ( white ) builds upon the same fundamental non-repainting approach used by the first two. The difference in this variant is that it applies repainting control to tuples , which one cannot pass as the `expression` argument in our `htfSecurity()` function. Tuples are handy for consolidating `request.*()` calls when a script requires several values from the same context, as one can request a single tuple from the context rather than executing multiple separate request.security() calls.
This variant applies the internal logic of our `htfSecurity()` function in the script's global scope to request a tuple containing open and `srcInput` values from a higher timeframe with repainting control. Historically, Pine Script™ did not allow the history-referencing operator [ ] when requesting tuples unless the tuple came from a function call, which limited this technique. However, updates to Pine over time have lifted this restriction, allowing us to pass tuples with historical offsets directly as the `expression` in request.security() . By offsetting all items in a tuple `expression` by one bar and using barmerge.lookahead_on , we effectively retrieve a tuple of stable, non-repainting HTF values.
Since we cannot encapsulate this method within the `htfSecurity()` function and must execute the calculations in the global scope, the script's "Repainting" input directly controls the global `offset` and `lookahead` values to ensure it behaves as intended.
Variant 4 (Control)
Variant 4, which the script displays as a translucent orange plot, uses a default request.security() call, providing a reference point to compare the difference between a repainting request and the non-repainting variants outlined above. Whenever the script restarts its execution cycle, realtime bars become historical bars, and the request.security() call here will repaint the results on those bars.
█ Inputs
Repainting
The "Repainting" input (`repaintInput` variable) controls whether Variant 2 and Variant 3 are allowed to use fluctuating values from an unconfirmed HTF bar. If its value is `false` (default), these requests will only retrieve stable values from the last confirmed HTF bar.
Source
The "Source" input (`srcInput` variable) determines the series the script will use in the `expression` for all HTF data requests. Its default value is close .
HTF Selection
This script features two ways to specify the higher timeframe for all its data requests, which users can control with the "HTF Selection" input (`tfTypeInput` variable):
1) If its value is "Fixed TF", the script uses the timeframe value specified by the "Fixed Higher Timeframe" input (`fixedTfInput` variable). The script will raise a runtime error if the selected timeframe is not larger than the chart's.
2) If the input's value is "Multiple of chart TF", the script multiplies the value of the "Timeframe Multiple" input (`tfMultInput` variable) by the chart's timeframe.in_seconds() value, then converts the result to a valid timeframe string via timeframe.from_seconds() .
Timeframe Display
This script features the option to display an "information box", i.e., a single-cell table that shows the higher timeframe the script is currently using. Users can toggle the display and determine the table's size, location, and color scheme via the inputs in the "Timeframe Display" group.
█ Outputs
This script produces the following outputs:
• It plots the results from all four of the above variants for visual comparison.
• It highlights the chart's background gray whenever a new bar starts on the higher timeframe, signifying when confirmations occur in the requested context.
• To demarcate which bars the script considers historical or realtime bars, it plots squares with contrasting colors corresponding to bar states at the bottom of the chart pane.
• It displays the higher timeframe string in a single-cell table with a user-specified size, location, and color scheme.
Look first. Then leap.

Pinescript - Common String Functions Library by RRBCommon String Functions Library by RagingRocketBull 2021
Version 1.0
Pinescript now has strong support for arrays with many powerful functions, but still lacks built-in string functions. Luckily you can easily process and manipulate strings using arrays.
This script provides a library of common string functions for everyday use, such as: indexOf, substr, replace, ascii_code, str_to_int etc. There are 100+ unique functions (130 including all implementations)
It should serve as building blocks to speed up the development of your custom scripts. You should also be able to learn how Pinescript arrays works and how you can process strings.
Similar libraries for Array and Statistical Functions are in the works. You can find the full list of functions below.
Features:
- 100+ unique string functions (130 including all implementations) in categories: lookup, testing, conversion, modification, extraction, type conversion, date and time, console output
- Live Output for all/selected functions based on User Input. Test any function before using in script.
- Live Unit Test Output for several functions based on pre-defined inputs.
- Output filters: show unique functions/all implementations, grouping
- Console customization options: set custom text size, color, page length
- Support for Pages - auto splits output into pages with fixed length, use pages in your scripts
- Several easy to use console output functions to speed up debugging/output.
WARNING:
- Compilation Time: 1 min
Notes:
- uses Pinescript v3 Compatibility Framework
- this script is packed to the max and sets a new record in testing of Pinescript's limits: 500 local scopes, 4000+ lines, 180kb+ source size. It's not possible to add more ifs/fors/functions without reducing functionality
- to fit the max limit of local scopes = 500 all ifs were replaced with ?: where possible, the number of function calls was reduced, some calls replaced with inline function code
- ifs are faster (especially when lots of them are used in a for cycle), more readable, but ifs/fors/functions increase local scopes (+1) and compiled file size, have max nesting limit = 10.
- ?: are slower (especially in for cycles), hard to read when nested, don't affect local scopes, reduce compiled file size, can't contain plots, for statements (break/continue) and sets of statements
- for most array functions to work (except push), an array must be defined with at least 1 pre-existing dummy element 0.
- if you see "String too long" error - enable Show Pages, reduce Max Chars Per Page < Max String Length limit = 4096.
- if you see "Loop too long" error - hide/unhide or reattach the script
- some functions have several implementations that can be faster/slower, use internal code/ext functions
- 1 is manual string processing using for cycles (array.get) and ext functions - provided in case you want to implement your own logic, may sometimes be slower
- 2 is a 2nd alternate implementation mostly done using built-in functions (array.indexof, array.slice, array.insert, array.remove, str.replace_all),
attempts to minimize local scopes and dependency on ext functions, should generally be faster
- 3 is a 3rd alternate (array.includes, array.fill) or a more advanced implementation (datetime3_str) with lots of params, giving you the most control over output
- most functions have dependencies, such as const names, global arrays, inputs, other functions.
P.S. Strings of Time may be closed unto themselves or have loose ends; they can vibrate, stretch, join or split.
Function Groups:
1. Char Functions
- repeat(str, num)
- ascii_char(code)
- ascii_code(char)
- is_digit(char)
- is_letter(char)
- digit_to_int(char)
- is_space_char(char)
2. Char Test and Lookup Functions
- char_at(str, pos)
- char_code_at(str, pos)
- indexOf_char(str, char)
- lastIndexOf_char(str, char)
- nth_indexOf_char(str, char, num)
- includes_char(str, char)
3. String Lookup Functions
- indexOf(str, target)
- lastIndexOf(str, target)
- nth_indexOf(str, target, num)
- indexesOf(str, target)
- numIndexesOf(str, target)
4. String Conversion Functions
- lowercase(str)
- uppercase(str)
5. String Modification and Extraction Functions
- split(str, separator)
- insert(str, pos, new_str)
- remove(str, pos, length)
- insert_char(str, pos, char)
- remove_char(str, pos)
- reverse(str)
- fill_char(str, char, start_pos, end_pos)
- replace(str, target, new_str)
- replace_first(str, target, new_str)
- replace_last(str, target, new_str)
- replace_nth(str, target, new_str, num)
- replace_left(str, new_str)
- replace_right(str, new_str)
- replace_middle(str, pos, new_str)
- left(str, num)
- right(str, num)
- first_char(str)
- last_char(str)
- truncate(str, max_len)
- truncate_middle2(str, trunc_str, pos, max_len)
- truncate_from2(str, trunc_str, pos, max_len, side)
- concat(str1, str2, trunc_str, max_len, mode)
- concat_from(str1, str2, trunc_str, max_len, side, mode)
- trim(str)
- substr(str, pos, length)
- substring(str, start_pos, end_pos)
- strip(str, mask, target, is_allowed)
- extract_groups(str)
- extract_numbers(str, d1, d2, mode)
- str_to_float(str, d1, d2)
- str_to_int(str)
- extract_ranges(str, d1, d2, d3, type)
6. String Test Functions
- includes(str, target)
- starts_with(str, target)
- ends_with(str, target)
- str_compare(str1, str2)
7. Type Conversion Functions
- tf_check2(tf)
- tf_to_mins()
- convert_tf(tf)
- period_to_mins(tf)
- convert_tf2(tf)
- convert_tf3(tf)
- bool_to_str(flag)
- get_src(src_str)
- get_size(size_str)
- get_style(style)
- get_bool(bool_str)
- get_int(str)
- get_float(str, d1, d2)
- get_color(str, def_color)
- color_tr2(col_str, transp)
- get_month(str)
- month_name(num, format)
- weekday_name(num, format)
- dayofweek_name(t)
8. Date and Time Functions
- date_str(t, d)
- time_str(t, d)
- datetime_str(t, d1, d2)
- date2_str(t, d, type)
- time2_str(t, d, type)
- datetime2_str(t, d1, d2, format1, format2)
- date3_str(t, template)
- time3_str(t, template)
- datetime3_str(t, template)
9. Console Output & Helper Functions
- echo1(con, str)
- echo2(x, y, con, str)
- echo3(v_shift, con, str, msg_color, text_size)
- echo4(x, y, con, str, msg_style, msg_color, text_size, text_align, msg_xloc)
- echo5(x, y, con, str, msg_style, msg_color, text_size, text_align, msg_xloc)
- echo6(x, y, con, str)
- echo7(v_shift, con, str, msg_color, text_size)
- echo8(x, y, con, str, msg_style, msg_color, text_size, text_align, msg_xloc)
- echo9(x, y, con, str, msg_style, msg_color, text_size, text_align, msg_xloc)
- new_page(str, line_str, trunc_str, header_str, footer_str, length, page_count, page, mode)

[blackcat] L2 Zero-lag EMA Swing TradeLevel: 2
Background
This script is a comprehensive work of mine, incorporating Ehlers zero-lag EMA and my first script published: MA fingerprint for long entries.
Function
Ehlers zero-lag EMA algorithm in this scripts is mainly used for short signal production, while my MA fingerprint algorithm is used for long entries.
Key Signal
a ---> Ehlers Zero-lag EMA fast line for subjective long jugement
b ---> Ehlers Zero-lag EMA slow line for subjective short jugement
long --> Swing long entry with partial postion
short --> Swing short entry with partial postion
Remarks
Feedbacks are appreciated. This script is optimized for 1D time frame.
Readme
In real life, I am a prolific inventor. I have successfully applied for more than 60 international and regional patents in the past 12 years. But in the past two years or so, I have tried to transfer my creativity to the development of trading strategies. Tradingview is the ideal platform for me. I am selecting and contributing some of the hundreds of scripts to publish in Tradingview community. Welcome everyone to interact with me to discuss these interesting pine scripts.
The scripts posted are categorized into 5 levels according to my efforts or manhours put into these works.
Level 1 : interesting script snippets or distinctive improvement from classic indicators or strategy. Level 1 scripts can usually appear in more complex indicators as a function module or element.
Level 2 : composite indicator/strategy. By selecting or combining several independent or dependent functions or sub indicators in proper way, the composite script exhibits a resonance phenomenon which can filter out noise or fake trading signal to enhance trading confidence level.
Level 3 : comprehensive indicator/strategy. They are simple trading systems based on my strategies. They are commonly containing several or all of entry signal, close signal, stop loss, take profit, re-entry, risk management, and position sizing techniques. Even some interesting fundamental and mass psychological aspects are incorporated.
Level 4 : script snippets or functions that do not disclose source code. Interesting element that can reveal market laws and work as raw material for indicators and strategies. If you find Level 1~2 scripts are helpful, Level 4 is a private version that took me far more efforts to develop.
Level 5 : indicator/strategy that do not disclose source code. private version of Level 3 script with my accumulated script processing skills or a large number of custom functions. I had a private function library built in past two years. Level 5 scripts use many of them to achieve private trading strategy.
10x HTF Candles Dynamic with LTF FVG and Key LevelsPurpose
The 10x HTF Candles Dynamic Pine Script is a versatile, all-in-one trading tool designed for TradingView to empower traders with actionable insights across multiple timeframes. It combines advanced price action analysis, Fair Value Gap (FVG) detection, market structure evaluation, and key level visualization into a single, highly customizable interface. Built for day traders, swing traders, and scalpers, this script enhances decision-making by providing a clear, multi-dimensional view of market dynamics, liquidity zones, and trend biases. Its purpose is to streamline technical analysis, reduce chart clutter, and deliver real-time, visually intuitive data to support precise trading strategies.
What the Script Does
How the Script Works:
The script leverages Pine Script v5’s advanced features to deliver a robust and efficient trading tool. Below is a step-by-step explanation of its functionality:
1. Initialization and Configuration:
- Initializes with @version=5, enabling dynamic requests, and sets limits for bars (500), lines, labels, boxes, and polylines to manage resources.
- Defines user inputs for candle settings, timeframe selection, FVG parameters, DWM levels, market structure table, and visual preferences.
- Dynamically calculates 10 higher timeframes based on the current chart timeframe (e.g., 1m chart → 5m, 15m, 60m, etc.) or allows custom timeframes.
2. Data Acquisition:
- Fetches OHLC data for up to 10 timeframes using request.security, storing it in optimized TfData objects (arrays for open, high, low, close).
- Loops through enabled timeframes to minimize redundant code, improving processing speed.
3. Candlestick Rendering:
- Draws HTF candlesticks at user-defined offsets, with customizable bullish/bearish colors, wick colors, and widths.
- Calculates bar types (Inside, Normal, Outside) and optionally labels them above candles for pattern analysis.
4. FVG Detection and Visualization:
- Scans for FVGs by comparing candle highs and lows across three bars (e.g., low of candle 1 > high of candle 3 for bullish FVG).
- Detects IFVGs based on user-selected methods (wick, close, or midpoint) and highlights them with distinct colors.
- Draws FVG boxes with configurable borders, midpoint lines, and labels, tracking mitigation status.
- Limits FVG display to a user-defined maximum (1–200) to maintain chart clarity.
5. Horizontal Levels and DWM Lines:
- Computes Highs, Lows, Midpoints, and Quarter Points for each timeframe, drawing lines with customizable styles and extensions.
- Plots DWM open, close, high, low, and control point lines, with optional alerts for high/low breaks.
- Supports session-based opening price lines (e.g., 09:30 Market Open) with similar customization.
6. Market Structure and Bias:
Calculates trend bias by comparing the current close to the midpoint of the timeframe’s range (highest high to lowest low).
Updates a market structure table with timeframe, bias, and premium/discount status, using color-coded cells for quick interpretation.
7. Countdown Timers:
- Converts timeframe strings to seconds and calculates the time remaining until the next candle using timenow.
- Renders countdown labels with timeframe names (e.g., “1h\n(00:45)”) at user-defined positions.
8. Optimization and Cleanup:
- Uses VisualElements UDTs to manage lines, wicks, and labels, reducing memory usage.
- Deletes outdated drawings when limits are exceeded, ensuring a clean and responsive chart.
- Employs loops and arrays to streamline repetitive tasks, enhancing performance.
How to Use the Script:
This script is user-friendly yet powerful, suitable for traders of all experience levels. Follow these steps to maximize its potential:
1. Add to TradingView:
- Copy the script into TradingView’s Pine Editor.
- Click “Add to Chart” to apply it to your active chart.
2. Customize Settings:
- Candle Settings: Adjust the number of candles (1–10), starting position, group spacing, bullish/bearish colors, wick colors, and candle width.
- Timeframe Settings: Enable/disable up to 10 timeframes, choosing dynamic (auto-selected) or custom timeframes (e.g., 3m, 60m, D).
- FVG Settings: Toggle FVG detection, set detection methods (wick/close/midpoint), adjust thresholds, and customize colors, borders, and midpoint lines.
- DWM Settings: Enable daily/weekly/monthly lines (open, close, high, low, midpoint), set colors, and configure alerts for high/low breaks.
- Market Structure Table: Show/hide columns for timeframe, trend bias, and premium/discount, and adjust table position (top-left, bottom-right, etc.).
- Countdown Timers: Enable timers, adjust offsets, and customize text/background colors.
- Label Settings: Configure price label precision, transparency, and offsets for clarity.
3.Interpret Visuals:
- Candlesticks: Analyze HTF candles to gauge trend direction and momentum across timeframes.
- FVGs: Look for unmitigated FVGs (colored boxes) as potential support/resistance zones or trade setups.
- Key Levels: Use Highs, Lows, Midpoints, and Quarter Points to identify breakout or reversal areas.
4. Market Structure Table: Check trend bias and premium/discount status to align trades with market conditions.
- DWM Lines: Monitor daily/weekly/monthly levels for institutional reference points.
- Countdown Timers: Time entries/exits based on upcoming candle formations.
5. Integrate with Strategy:
- Combine script insights with your trading plan (e.g., use FVGs for entries, key levels for stops/targets).
- Set alerts for high/low breaks or liquidity zone approaches to stay proactive.
- Export table data or screenshot visuals for documentation and analysis.
6. Optimize Performance:
Limit the number of candles, FVGs, and lines to match your device’s capabilities.
Regularly review settings to focus on the most relevant timeframes and features.
Why the Script is Original
The 10x HTF Candles Dynamic script stands out in the TradingView community due to its innovative design, comprehensive functionality, and trader-centric approach. Here’s what makes it unique:
1. Seamless Multi-Timeframe Integration:
- Unlike single-timeframe indicators, this script synthesizes data from up to 10 timeframes, offering a holistic view of market structure.
- Dynamic timeframe selection adapts to the chart’s timeframe, ensuring relevance across all trading styles.
2 . Advanced FVG and IFVG Detection:
- Provides granular control over FVG detection with three IFVG methods (wick, close, midpoint), a rarity in most scripts.
- Tracks mitigation status and highlights unmitigated FVGs, enabling traders to capitalize on high-probability setups.
- Visualizes FVGs with boxes, midpoint lines, and labels, enhancing clarity and usability.
3. Sophisticated Market Structure Analysis:
-The bias calculation, introduced in recent updates (2 days ago), uses a robust algorithm to assess trend direction based on range midpoints.
- The market structure table, with premium/discount zones (added 20 hours ago), offers a unique summary of market conditions, unmatched by standard indicators.
4. Comprehensive DWM and Session Support:
- Integrates daily, weekly, and monthly levels alongside session-based opening prices, catering to institutional and retail traders alike.
- Customizable alerts for high/low breaks add actionable functionality.
5. Visual Hierarchy and Clarity:
- Scales line widths and transparency by timeframe, prioritizing higher timeframes for strategic focus.
- Countdown timers provide real-time context, a feature rarely seen in multi-timeframe scripts.
6.Performance Optimization:
- Recent updates introduced loops and UDTs to reduce code redundancy and boost processing speed.
- Automated cleanup mechanisms prevent chart clutter, ensuring smooth operation even on low-resource devices.
7. High Customizability:
- Offers extensive settings for visuals, timeframes, FVGs, DWM lines, and alerts, accommodating diverse trading preferences.
- Balances complexity with accessibility, making it approachable for beginners and powerful for advanced users.
8.Continuous Evolution:
- Regular updates (e.g., bias filter table, premium/discount feature, code optimization) demonstrate ongoing commitment to improvement.
- Closed-source protection (noted 20 hours ago) ensures intellectual integrity while allowing free use, fostering trust in the TradingView community.
Conclusion
The 10x HTF Candles Dynamic Pine Script is a groundbreaking tool that redefines multi-timeframe analysis on TradingView. By combining candlestick visualization, FVG detection, market structure insights, DWM levels, and countdown timers, it provides traders with a comprehensive, real-time view of market dynamics. Its advanced optimization, customization options, and continuous updates make it a standout choice for traders seeking precision, clarity, and efficiency. Whether you’re scalping intraday moves or swing trading weekly trends, this script equips you with the tools to master the markets with confidence.

Volume Profile Range For All AccountsVolume Profile Range For All Accounts is displaying volume from price perspective. It’s done by summing volume by the “estimated” transaction price. This version is estimating it based on public volume data so it can be used with any account.
Volume Profile is a powerful tool commonly used by PRO users, to disseminate its use also by users who operate on basic volume data, we have prepared a set of scripts:
Volume Profile For All Accounts – Analyze last 50-20000 bars.
Volume Profile From Date For All Accounts – Analyze all bars since start date.
Volume Profile Range For All Accounts – Analyze bars in a range between start and end date.
Traiding View is supporting paid users with Volume Profile on extended volume dataset. We recommend to use it, because of access to more precise data.
Script Initialization:
After adding this script to the chart, a blue dialog with ‘Set the “start date” time for “VPR”’ label will be shown. You should pick ‘start date’ on the chart by pressing point on the chart. A line will appear in that place, that can be moved later by move over and catching a rectangle dot over the line.
After ‘start date’ selection, a blue dialog with ‘Set the “end date” time for “VPR”’. You should pick the ‘end date’ on the chart by pressing point on the chart. A line will appear in that place, that can be moved later by move over and catching a rectangle dot over the line.
If picked range is too small, a red label “Range should be bigger than 50 bars” will be shown. In that case just catch the rectangle dot over the line and move it to increase the range.
Settings:
SCANNER VISUALIZATION
Start date – Start date from which bars should be taken into account during calculations. For the narrow range, the estimation may differ significantly from the Volume Profile available for Paid Traiding View users.
End date – End date to which bars should be taken into account during calculations. For the narrow range, the estimation may differ significantly from the Volume Profile available for Paid Traiding View users.
Rows – Number of rows
Width – Width of the visualization.
Position – Position of the visualization:
S_DU – At START of the area, DOWN first
S_UD – At START of the area, UP first
BE_DU – At BEFORE END of the area, DOWN first
BE_UD – At BEFORE END of the area, UP first
E_DU – At END of the area, DOWN first
E_UD – At END of the area, UP first
Color Up – Color of volume classified as move Up, or Both if separation is off.
Color Down - Color of volume classified as move Down
Color Border – Border color.
Up/Down separate – Draw separate volume classified as Up and Down
Show values – Showing volume values of the bars.
Troubleshooting:
In case of any problems, send error details to the author of the script.
40+ Coin Screener (workaround to 40 Security Limit Per Script) This is a far inferior method for a screener/scanner (compared to my first publication) but after looking at that script from a noobs eyes again, I could see how this form would be a lot easier to take in/understand so wanted to publish it. Everything that I could think of to mention about this is in my 1st pub so ill leave it to you to check it out...though I did include some comments in the script. It is pretty straight forward but if you have any questions don't hold them in. I'll answer them if I can. The only thing that is not in this one is setting up the alert feature so that you only have to create 1 alert per iteration of the script and it takes care of all of the coins for that iteration/set that is chosen in the settings (so please see previous script if would like to do this for your screener/scanner).
To be PERFECTLY CLEAR, the workaround is to the issue of not being able to scan but only 40 coins per script. You can scan more than 40 per script but only if you create "batches" or "sets" that the user can select within the settings which set to use for each iteration of the script on the chart. That being, you have to the script multiple times to the chart and merge them into 1 window and merge the scales (instructions in first publications). Here in this script I am scanning 72 different coins that are the Margin Coins on KUCOIN. I have split them up into 3 sets (24 coins per set). I could have made 2 sets but the script will be slower to load and to respond (like, when it comes to receiving alerts), thus I split them up the way I did. If you want to change any of this there are slightly more details in the previous script.
One great use-case that I LOVE about this particular version (and the way I use it) is right at the end of when I see a whole market dump/pump coming to an end and want to know which horse to bet on. Used to think whichever coin come out the fastest from the dump was the one to bet on but quickly learned that 1-2 (or even a few) hrs needs to go by first bc the ones that look the strongest in the beginning are NOT the ones to have performed the best when viewing the results 12 hrs later. IN FACT, many instances of using this exact script for reasons as such has taught me that the manipulators (I believe this to be the case as least) WANT everyone to bet on these that come out the gate the hardest and thus they make them move REALLY hard in the beginning then they QUICKLY become stagnant (moreso, they become WORSE than stagnant, they actually quickly retrace to put you into the negative so that you get out to get into the others now moving (to provide the market with more liquidity. They WANT you to get into a coin thats moving crazy hard so that they can then cease that movement once many fall for the trick just to then make that once strong looking coin now stagnant and make others move crazy hard. They wait for you to get out of the 1st and into the next set of movers just to do this time and time again bc hey, what are we sheep good for other than to provide the big guns with liquidity, am I right? Thats rhetorical, which you would know if you've ever had this happen to you (without a doubt MANY of you have). Let this script (above all other things) provide good evidence to back up this cynical way of viewing the markets to anyone that is questioning it.
This prolonged time between when the dump is over and when the ACTUAL movers REALLY start moving can actually be of great benefit to us sheep if used correctly, Firstly, it gives us some time to determine if when we thought was the bottom, ACTUALLY was the bottom. That bottom is easily determined if there are no (or very few) coins that went any lower than the point in time that the script began calculating on. Secondly, it allows us time to wait for the REAL movers and shakers to start moving and shaking.
One new feature that I LOVE that TV has implemented is the ability (once the script is added to the chart) to be able to click a point in time on the chart where you want the script to begin its calculations. If this point needs to be changed at any point in time then you can either go into the setting and input the time you wish or simply remove the script and add it again so that you are prompted to select another point in time. Ok, I think that everything I wanted to say. The next version that I will add will be probably my favorite and most used by yours truly...not to mention unique in a way that I have yet to see an implementation anything like it in all of TV's public library. Not to say its not there, but I have yet to come across it and I have DEFINITELY done my fair share of searching for it when I couldn't figure out how to code it for the longest time (though, I was and still am a noob so might get some great feedback on better ways to approach it, but we'll save that jabbering for the next of the publications.
I hope each and every one of ya'll (yes, Im from the South) have the GREATEST of Thanksgivings (if in the US that is...I graced my parents with the best gift anyone could have given them 35 years ago on Thanksgiving....MEEEE ;) So I will sure as hell be having a great holiday. Thanks for checking out my script...you can "like" and leave a comment if you so feel the urge to...or not. Im not doing this for me, but rather to stretch my arms out as far as possible to benefit the most people as possible and more people would see the script if it has more likes/comments/traffic pointing towards it...not to mention as other publishers have...it IS gratifying to see a few likes in my side window, which btw, I have MANY more variations and completely diff types of scanners/screeners Ill be publishing in the future and to know that they've become of use....I"VE become of use to the community is very....pleasing to me and does (as I've also seen many publishers mention as well) drive me to want to publish ones that I originally thought I would keep for myself. Peace out people.

[blackcat] L1 Jon Andersen R-Squared IndicatorLevel: 1
Background
The R-Squared indicator created by Jon Andersen in "Standard error bands" in the September 1996 STOCKS & COMMODITIES .
Function
This script fristly creates the coeffR function which is used to produced the R-Squared indicator. The coeffR function is used to calculate the correlation coefficient R. Once I have created and verified the coeffR function, the R-Sqaured indicator can be built easily.
Key Signal
AvgSqrR --> Smoothed R-Squared Oscillator Output.
Labels and alerts are added.
Remarks
Feedbacks are appreciated.
Readme
In real life, I am a prolific inventor. I have successfully applied for more than 60 international and regional patents in the past 12 years. But in the past two years or so, I have tried to transfer my creativity to the development of trading strategies. Tradingview is the ideal platform for me. I am selecting and contributing some of the hundreds of scripts to publish in Tradingview community. Welcome everyone to interact with me to discuss these interesting pine scripts.
The scripts posted are categorized into 5 levels according to my efforts or manhours put into these works.
Level 1 : interesting script snippets or distinctive improvement from classic indicators or strategy. Level 1 scripts can usually appear in more complex indicators as a function module or element.
Level 2 : composite indicator/strategy. By selecting or combining several independent or dependent functions or sub indicators in proper way, the composite script exhibits a resonance phenomenon which can filter out noise or fake trading signal to enhance trading confidence level.
Level 3 : comprehensive indicator/strategy. They are simple trading systems based on my strategies. They are commonly containing several or all of entry signal, close signal, stop loss, take profit, re-entry, risk management, and position sizing techniques. Even some interesting fundamental and mass psychological aspects are incorporated.
Level 4 : script snippets or functions that do not disclose source code. Interesting element that can reveal market laws and work as raw material for indicators and strategies. If you find Level 1~2 scripts are helpful, Level 4 is a private version that took me far more efforts to develop.
Level 5 : indicator/strategy that do not disclose source code. private version of Level 3 script with my accumulated script processing skills or a large number of custom functions. I had a private function library built in past two years. Level 5 scripts use many of them to achieve private trading strategy.

[blackcat] L1 Jon Andersen Standard Error BandsLevel: 1
Background
The standard error bands created by Jon Andersen in "Standard error bands" in the September 1996 STOCKS & COMMODITIES.
Function
This script calculates the beta and alpha coefficients of the linear regression. First, it creates the calcB and calcA functions, which refer to the beta and alpha coefficients. Create calcB first, then calcA. These functions are used in calculating the regression coefficients for the standard error bands. In This standard error bands indicator, the "Length" value specifies the period of the linear regression line; the default is 21. The SDeg value specifies the smoothing factor that is used to smooth the linear regression and standard error bands; the default is 3.
Key Signal
LinRegS --> standard error bands center line
LinRegS + SErr --> standard error bands upper line
LinRegS - SErr --> standard error bands lower line
Labels and alerts are added.
Remarks
Feedbacks are appreciated.
Readme
In real life, I am a prolific inventor. I have successfully applied for more than 60 international and regional patents in the past 12 years. But in the past two years or so, I have tried to transfer my creativity to the development of trading strategies. Tradingview is the ideal platform for me. I am selecting and contributing some of the hundreds of scripts to publish in Tradingview community. Welcome everyone to interact with me to discuss these interesting pine scripts.
The scripts posted are categorized into 5 levels according to my efforts or manhours put into these works.
Level 1 : interesting script snippets or distinctive improvement from classic indicators or strategy. Level 1 scripts can usually appear in more complex indicators as a function module or element.
Level 2 : composite indicator/strategy. By selecting or combining several independent or dependent functions or sub indicators in proper way, the composite script exhibits a resonance phenomenon which can filter out noise or fake trading signal to enhance trading confidence level.
Level 3 : comprehensive indicator/strategy. They are simple trading systems based on my strategies. They are commonly containing several or all of entry signal, close signal, stop loss, take profit, re-entry, risk management, and position sizing techniques. Even some interesting fundamental and mass psychological aspects are incorporated.
Level 4 : script snippets or functions that do not disclose source code. Interesting element that can reveal market laws and work as raw material for indicators and strategies. If you find Level 1~2 scripts are helpful, Level 4 is a private version that took me far more efforts to develop.
Level 5 : indicator/strategy that do not disclose source code. private version of Level 3 script with my accumulated script processing skills or a large number of custom functions. I had a private function library built in past two years. Level 5 scripts use many of them to achieve private trading strategy.
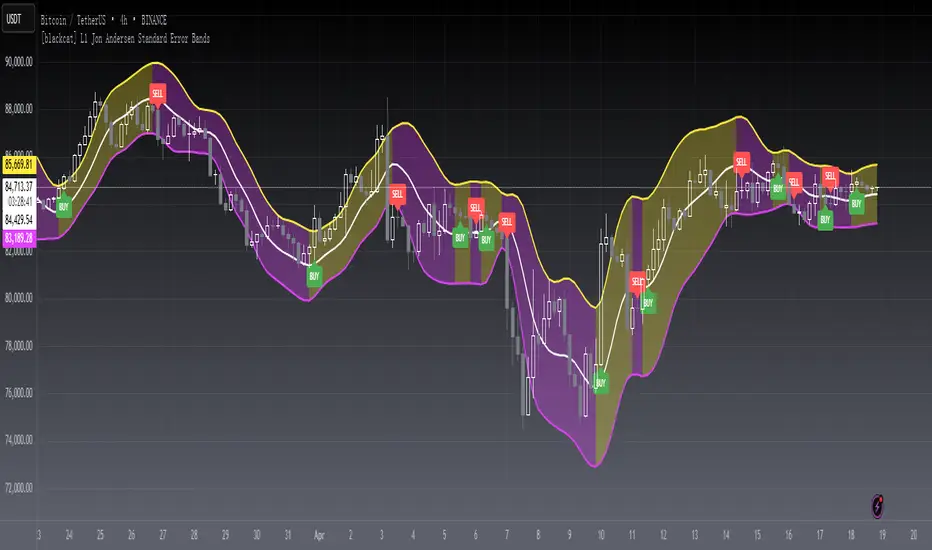
[blackcat] L1 Vitali Apirine Rate Of Change With BandsLevel: 1
Background
Vitali Apirine introuced this RoC indicator of “Rate Of Change With Bands” on March 2021.
Function
In Vitali Apirine's article “Rate Of Change With Bands” , the author introduces a concept of identifying overbought and oversold levels based on calculating standard deviation bands of the rate of change (ROC) momentum oscillator. The rate of change bands widen and narrow as the ROC deviation increases and decreases. The author proposes using this indicator in conjunction with other technical analysis methods to determine if the instrument is overbought or oversold.
Key Signal
UpperBand --> overbought threshold
oMARoc --> Output RoC Moving Average
LowerBand --> oversold threshold
Labels
L --> Long
S --> Short
XL --> Close Long
XS --> Close Short
Pros and Cons
100% Vitali Apirine definition translation, even variable names are the same. This help readers who would like to use pine to read his article.
Remarks
The 1st script for Blackcat1402 Vitali Apirine series publication.
Readme
In real life, I am a prolific inventor. I have successfully applied for more than 60 international and regional patents in the past 12 years. But in the past two years or so, I have tried to transfer my creativity to the development of trading strategies. Tradingview is the ideal platform for me. I am selecting and contributing some of the hundreds of scripts to publish in Tradingview community. Welcome everyone to interact with me to discuss these interesting pine scripts.
The scripts posted are categorized into 5 levels according to my efforts or manhours put into these works.
Level 1 : interesting script snippets or distinctive improvement from classic indicators or strategy. Level 1 scripts can usually appear in more complex indicators as a function module or element.
Level 2 : composite indicator/strategy. By selecting or combining several independent or dependent functions or sub indicators in proper way, the composite script exhibits a resonance phenomenon which can filter out noise or fake trading signal to enhance trading confidence level.
Level 3 : comprehensive indicator/strategy. They are simple trading systems based on my strategies. They are commonly containing several or all of entry signal, close signal, stop loss, take profit, re-entry, risk management, and position sizing techniques. Even some interesting fundamental and mass psychological aspects are incorporated.
Level 4 : script snippets or functions that do not disclose source code. Interesting element that can reveal market laws and work as raw material for indicators and strategies. If you find Level 1~2 scripts are helpful, Level 4 is a private version that took me far more efforts to develop.
Level 5 : indicator/strategy that do not disclose source code. private version of Level 3 script with my accumulated script processing skills or a large number of custom functions. I had a private function library built in past two years. Level 5 scripts use many of them to achieve private trading strategy.
